Normative, a sustainability reporting system

About the project
Having in mind a faster transition towards a sustainable society, Normative built a tool to score a company's social and environmental sustainability.
Using artificial intelligence combined with what Normative describes as one of the world's largest emissions databases, the platform runs the calculations. Users get advanced visual analytics, detailed reports, and step-by-step recommendations toward the Sustainable Development Goals.
By the time we started working with Normative, it was a fully functioning business looking for a robust solution to automate processes. Previously the team worked with freelancers, who could not satisfy the project requirements in scope and complexity, so Normative was looking for a partner to work with on the product. Our cooperation started with the frontend: refactoring and fixing the existing components.
Services
Tech stack
The app is built with Angular. Papa Parse and the xlsx library handle client-side parsing, Microsoft Power BI renders the analytics, Auth0 covers authorization, @ngx-translate handles localization, and ag-grid powers the reporting tables.
What the scope of our work included
Problem
Document, CSV and XLS parsing
Solution
We used two libraries for quick parsing of data on the client side. Papa Parse configures header row options, specifies or auto-detects delimiters, identifies the character for commented rows and converts numbers and booleans to their types. The xlsx library parses binary input into workbooks and worksheets, and the worksheet then gets converted to JSON.
Problem
Document validation
Solution
All uploaded data has to match a JSON schema. We used the Ajv library, the fastest JSON Schema validator available and one that is still actively maintained.
Problem
Info charts
Solution
App analytics had to include complex graphs and benchmarks. We used Microsoft Power BI to display data charts: reports, data sources and transaction impacts get uploaded from the server app, and the client uses the powerbi-client library to request the Power BI API and render charts in an iframe.
Problem
Authorization system
Solution
As part of the authorization solution we used Auth0. It provides a web interface to configure API, database connection, authorization rules and email templates. Users can sign in via email and password, use passwordless sign-in via email or SMS confirmation, or use the OAuth2 flow.
Problem
Localization
Solution
For content translation we used the @ngx-translate library. Translation tokens are stored in JSON files on the client side, and TranslateService implements both sync and async translation; the translate pipe allows translating content directly in a component's template.
Problem
Organization and user management
Solution
Organizations are created and managed by the app admin only and have different access to application modules; each one has its own dataset in Power BI based on its data sources and reports. Accounts are provisioned rather than self-served: users are created by the app admin or invited by an organization admin, can belong to several organizations, and their access is managed via application and organization roles.
Problem
Table creation
Solution
A convenient reporting process depends on top-level tables. We used the ag-grid library: separate Angular components render header and data cells, with sorting, filtering, pagination and row drag-and-drop, and the table can be expanded by a custom context menu, sidebars and row grouping.
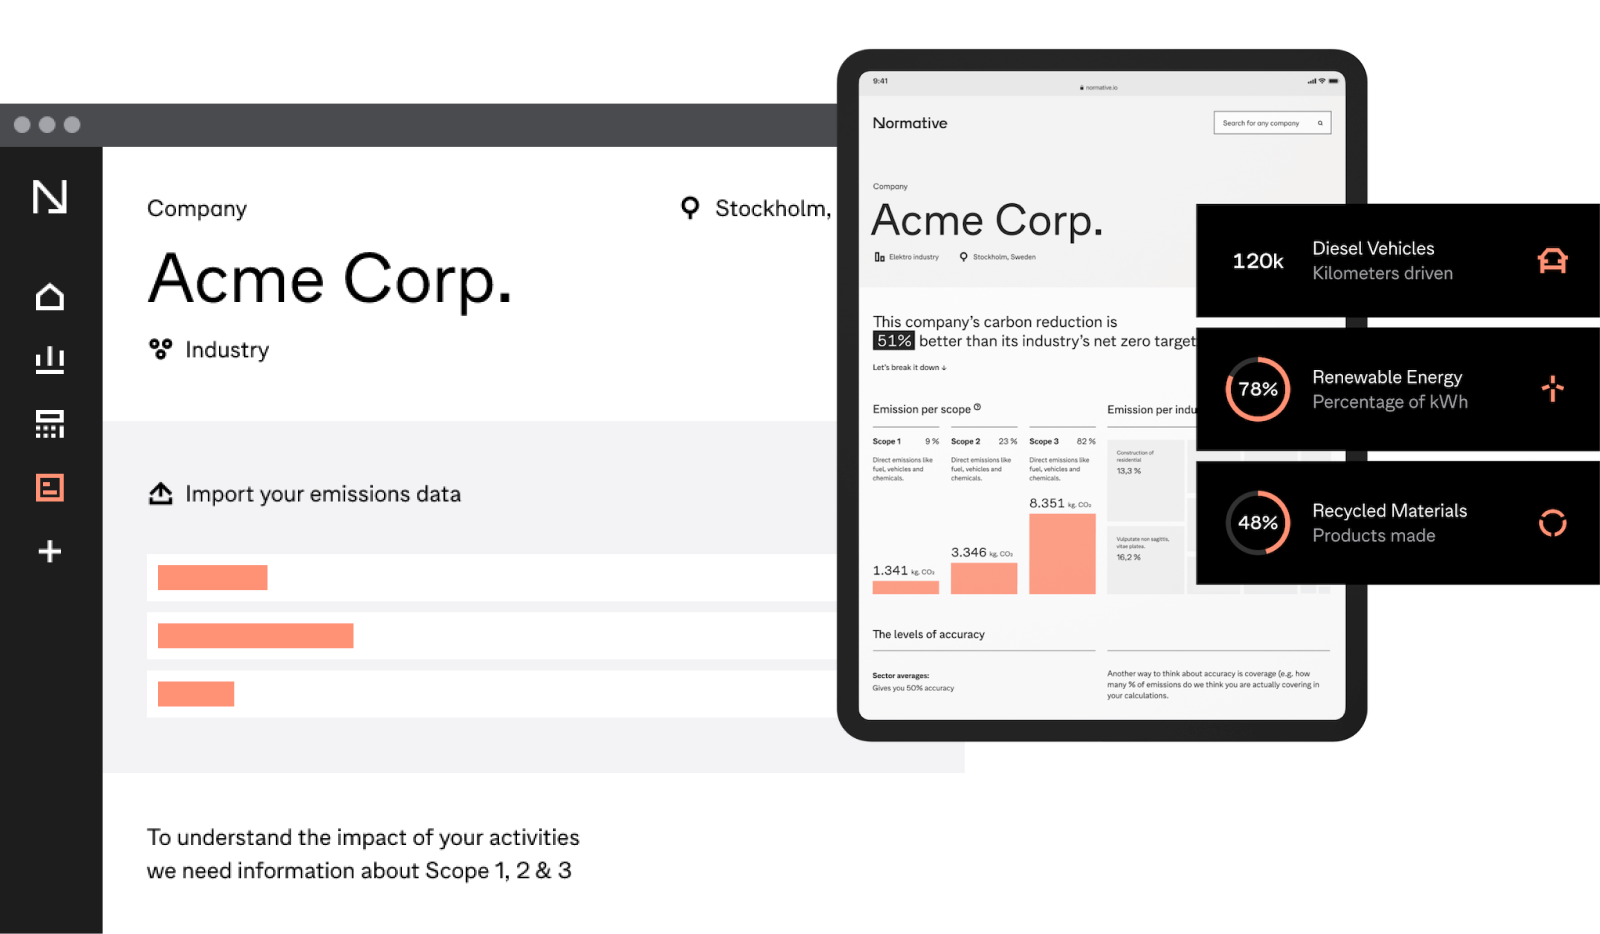
The reporting dashboardAnalytics, reports and recommendations in one workspace, built on Power BI and Angular.

Results
The Normative team wanted to respond to current environmental challenges and help businesses achieve the Sustainable Development Goals using automated calculations and in-depth analytics.
We used the best practices of Angular web development to create a custom software solution: parsing and validating uploaded documents, rendering the analytics, and covering authorization, localization and multi-organization access, the parts a reporting system stands on.
Building something in this shape? Tell us about it, or get a range in two minutes.
Questions about this build
Who built Normative's sustainability reporting platform?
2muchcoffee built Normative, an AI-powered sustainability reporting platform that automates the calculations behind a company's sustainability index, drawing on what Normative describes as one of the world's largest emissions databases.
Can 2muchcoffee build AI-powered data and reporting platforms?
Yes. Normative is a production data platform that combines AI with a large external database to turn raw company data into audited sustainability and SDG reports.